Feature generation methods#
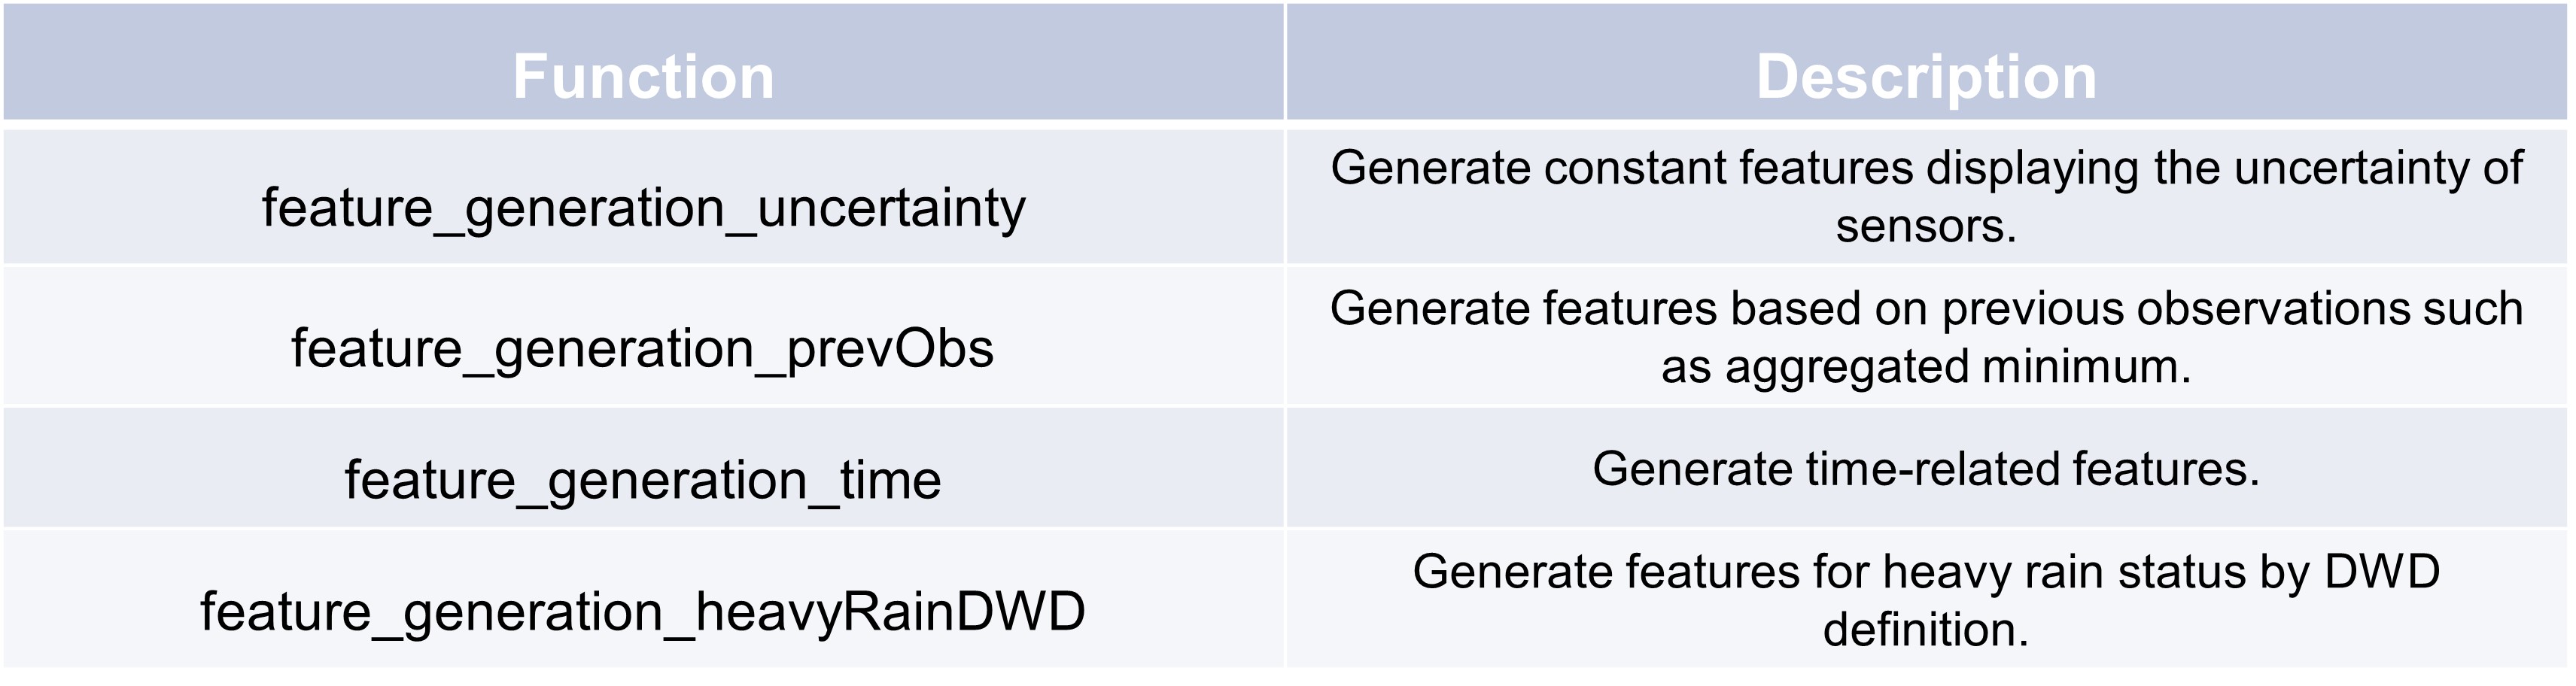
An example feature generation method is shown.
This code generates a DataFrame with random data simulating weather-related features and applies the
feature_generation_uncertainty function from TSCC.preprocessing. The resulting DataFrame contains the
original columns ground_truth, raw, fea_1, and fea_2, with an added column,
sensor1, representing sensor uncertainty (set to 0.2 for all rows). The resulting DataFrame showcases how
uncertainty can be integrated into weather event analysis, enhancing model robustness.
>>> # Set random seed for reproducibility
>>> np.random.seed(0)
>>> # Generate random data
>>> data = np.random.randn(100, 4)
>>> date_range = pd.date_range(start='2024-08-01', periods=100, freq='5min', name = "timestamp")
>>> # Create DataFrame with specified column names
>>> df = pd.DataFrame(data, columns=["ground_truth", "raw", 'fea_1', 'fea_2'], index = date_range)
>>> df["raw"] = df["ground_truth"] + np.random.normal(0, 5, 100)*np.random.randint(0, 2, 100)
>>> TSCC.preprocessing.feature_generation_uncertainty(df, {"sensor1": 0.2})
                     ground_truth       raw     fea_1     fea_2  sensor1
timestamp
2024-08-01 00:00:00      1.764052  1.764052  0.978738  2.240893      0.2
2024-08-01 00:05:00      1.867558 -3.711927  0.950088 -0.151357      0.2
2024-08-01 00:10:00     -0.103219  3.730097  0.144044  1.454274      0.2
2024-08-01 00:15:00      0.761038  2.542502  0.443863  0.333674      0.2
2024-08-01 00:20:00      1.494079 -7.348613  0.313068 -0.854096      0.2
...                           ...       ...       ...       ...      ...
2024-08-01 07:55:00     -1.698106 -2.067729 -2.255564 -1.022507      0.2
2024-08-01 08:00:00      0.038631  0.038631 -0.985511 -1.471835      0.2
2024-08-01 08:05:00      1.648135 -0.923035  0.567290 -0.222675      0.2
2024-08-01 08:10:00     -0.353432 -5.443641 -0.291837 -0.761492      0.2
2024-08-01 08:15:00      0.857924  0.468650  1.466579  0.852552      0.2

[100 rows x 5 columns]
The following code generates a DataFrame with random weather-related features and applies the
feature_generation_prevObs function from TSCC.preprocessing. The function adds new columns that capture
previous observations, such as ground_truth_5prev and ground_truth_10prev, which represent the values
from 5 and 10 minutes before the current one. Additionally, it computes rolling statistics like hourly and 6-hour sums
or minimums for features like code:fea_1 and fea_2, enhancing the dataset with time-based aggregated insights.
>>> # Set random seed for reproducibility
>>> np.random.seed(0)
>>> # Generate random data
>>> data = np.random.randn(100, 4)
>>> date_range = pd.date_range(start='2024-08-01', periods=100, freq='5min', name = "timestamp")
>>> # Create DataFrame with specified column names
>>> df = pd.DataFrame(data, columns=["ground_truth", "raw", 'fea_1', 'fea_2'], index = date_range)
>>> df["raw"] = df["ground_truth"] + np.random.normal(0, 5, 100)*np.random.randint(0, 2, 100)
>>> print(TSCC.preprocessing.feature_generation_prevObs(df, timestep = 5, agg_numobs = 12, agg_name = "h"))
                     ground_truth       raw     fea_1     fea_2  \
timestamp
2024-08-01 00:00:00      1.764052  1.764052  0.978738  2.240893
2024-08-01 00:05:00      1.867558 -3.711927  0.950088 -0.151357
2024-08-01 00:10:00     -0.103219  3.730097  0.144044  1.454274
2024-08-01 00:15:00      0.761038  2.542502  0.443863  0.333674
2024-08-01 00:20:00      1.494079 -7.348613  0.313068 -0.854096
...                           ...       ...       ...       ...
2024-08-01 07:55:00     -1.698106 -2.067729 -2.255564 -1.022507
2024-08-01 08:00:00      0.038631  0.038631 -0.985511 -1.471835
2024-08-01 08:05:00      1.648135 -0.923035  0.567290 -0.222675
2024-08-01 08:10:00     -0.353432 -5.443641 -0.291837 -0.761492
2024-08-01 08:15:00      0.857924  0.468650  1.466579  0.852552

                     ground_truth_5prev  ground_truth_10prev  \
timestamp
2024-08-01 00:00:00                 NaN                  NaN
2024-08-01 00:05:00            1.764052                  NaN
2024-08-01 00:10:00            1.867558             1.764052
2024-08-01 00:15:00           -0.103219             1.867558
2024-08-01 00:20:00            0.761038            -0.103219
...                                 ...                  ...
2024-08-01 07:55:00            0.643314             0.841631
2024-08-01 08:00:00           -1.698106             0.643314
2024-08-01 08:05:00            0.038631            -1.698106
2024-08-01 08:10:00            1.648135             0.038631
2024-08-01 08:15:00           -0.353432             1.648135

                     ...  fea_1_sum_h  fea_1_sum_6h  fea_2_min_h  \
timestamp            ...
2024-08-01 00:00:00  ...          NaN           NaN          NaN
2024-08-01 00:05:00  ...          NaN           NaN          NaN
2024-08-01 00:10:00  ...          NaN           NaN          NaN
2024-08-01 00:15:00  ...          NaN           NaN          NaN
2024-08-01 00:20:00  ...          NaN           NaN          NaN
...                  ...          ...           ...          ...
2024-08-01 07:55:00  ...    -5.023972    -16.145175    -1.437791
2024-08-01 08:00:00  ...    -5.325472    -17.257598    -1.471835
2024-08-01 08:05:00  ...    -4.070344    -15.419822    -1.471835
2024-08-01 08:10:00  ...    -3.997487    -15.298041    -1.471835
2024-08-01 08:15:00  ...    -1.766765    -15.699021    -1.471835


                     fea_2_mean_6h  fea_2_sum_h  fea_2_sum_6h
timestamp
2024-08-01 00:00:00            NaN          NaN           NaN
2024-08-01 00:05:00            NaN          NaN           NaN
2024-08-01 00:10:00            NaN          NaN           NaN
2024-08-01 00:15:00            NaN          NaN           NaN
2024-08-01 00:20:00            NaN          NaN           NaN
...                            ...          ...           ...
2024-08-01 07:55:00       0.164007    -1.432945     11.808516
2024-08-01 08:00:00       0.137982    -4.564330      9.934691
2024-08-01 08:05:00       0.121425    -3.572928      8.742619
2024-08-01 08:10:00       0.121230    -4.491124      8.728582
2024-08-01 08:15:00       0.120487    -2.200781      8.675089

[100 rows x 48 columns]